Tale of Two Profit Measures: Big Companies Perform Much Worse Than Smaller Firms in Q1
- Joe Carson

- May 28, 2020
- 2 min read
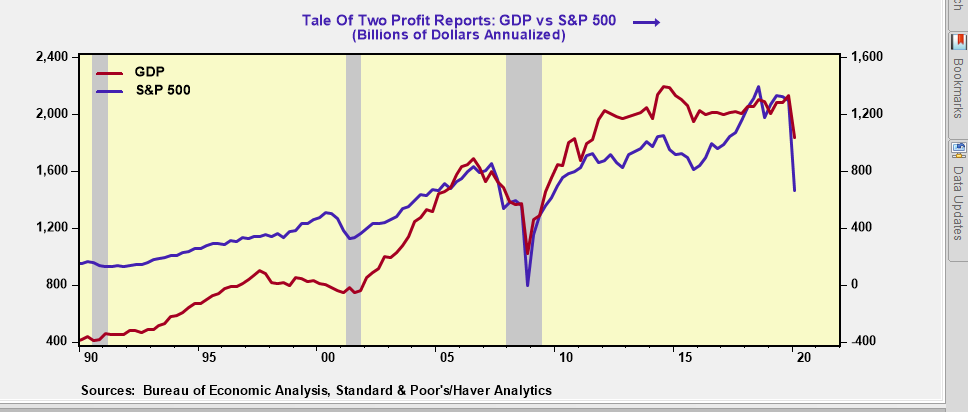
Operating profits for the S&P 500 companies fell four times more than the GDP-based measure of profits in Q1. The underperformance of large companies is because reported profits by S&P 500 firms include non-operating capital income and non-operating losses tend to become very large during recessions.
Equity valuations for S&P 500 companies are exceptionally high. Thus, the risk/reward ratio for buying equities remains poor.
A Tale of Two Profit Reports
In Q1, operating profits for all US companies fell 13.9% from Q4 2019. At $1.836 trillion in Q1 the GDP measure of operating profits stood at its lowest levels since Q3 2011.
The profit performance of S&P 500 companies was markedly worse. In Q1, operating profits for S&P 500 companies totaled $661 billion annualized, a record drop of 50%, or $637 billion from Q4. The Q1 operating profit figure for the S&P 500 companies is the lowest level since Q1 2010.
The GDP-based measure of profits and the reported figures by S&P 500 companies are not strictly comparable. The GDP measure is based on a tax accounting framework and is designed to reflect the income generated from current production.
S&P 500 profits are based on a financial accounting framework. This accounting framework allows companies to include non-operating profits and losses.
The largest non-operating items include capital gain income and losses, which could result from trading activities or a revaluation of an asset. Other accounting adjustments include pension valuation and pension interest adjustments, and write-downs, and goodwill impairments.
Past studies by the Bureau of Economic Analysis (BEA) has found that capital gain income and losses can amount to hundreds of billions in any given year, and by itself can explain much of the difference in the operating profit measures.
The decline in Q2 operating profits from the GDP report will be two or three times greater than the Q1 performance based on current quarter tracking of overall output contracting in the 30% to 40% range versus the 5% annualized decline in Q1 GDP. It's hard to predict what accounting adjustments S&P companies may or may not take in Q2, but the rebound in equity prices could limit the losses somewhat.
Regardless of what measure one uses (reported or actual operating profits), S&P equity valuations are selling at relatively high multiples. The happy prophecy of a sustained higher P/E multiple has been ascribed to several different factors, but none of these suggested reasons is fully persuasive. Equity valuations are forever linked to profits and growth---and today’s levels are excessive.


Comments