How Vulnerable Are Real Estate & Equity Markets To A Correction? Are Risks Higher Than 2000 & 2007?
- Joe Carson

- Oct 23, 2023
- 3 min read
Household net worth increased a staggering $43.4 trillion, driven by huge gains in real and financial asset market values, since the start of 2020. The gains in speed and scale raise questions about how vulnerable the real estate and equity markets are to a sharp correction. The risks are high since the market values of assets have been "pumped up" by massive monetary and fiscal stimulus. In the past twenty-five years, the US has experienced two substantial asset market value-driven gains in household wealth, and both cracked, triggering an economic downturn. Is a third asset-price-driven downturn on the horizon?
Historical Picture of Wealth & Asset Values
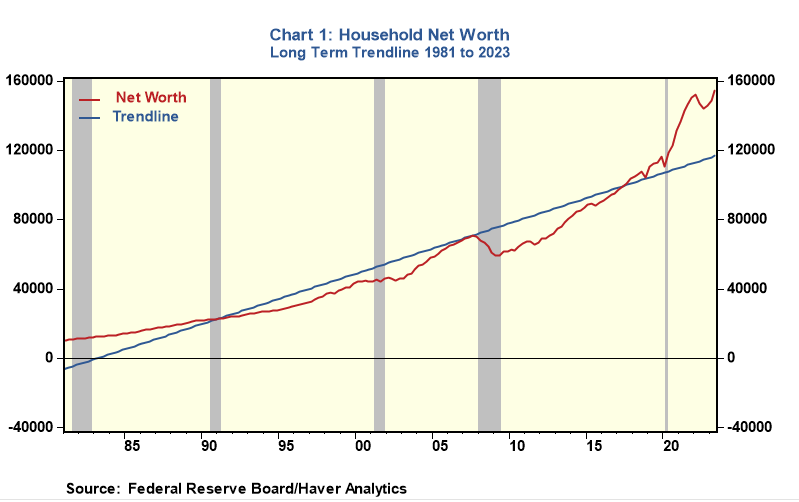
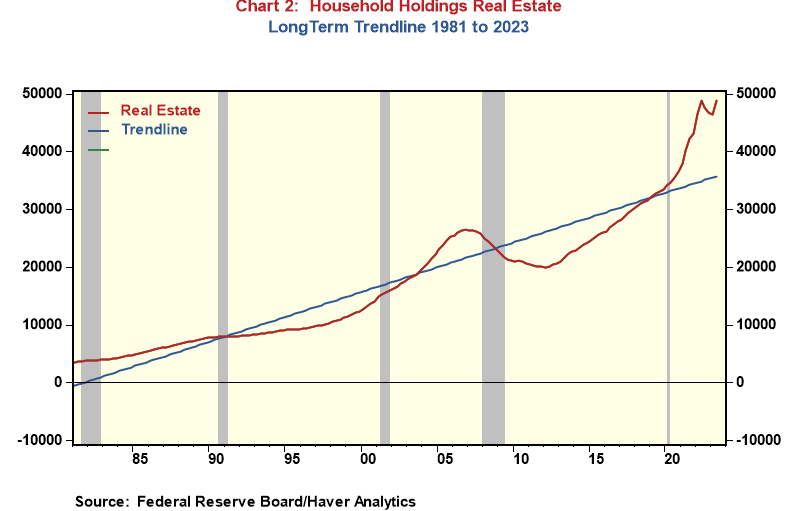
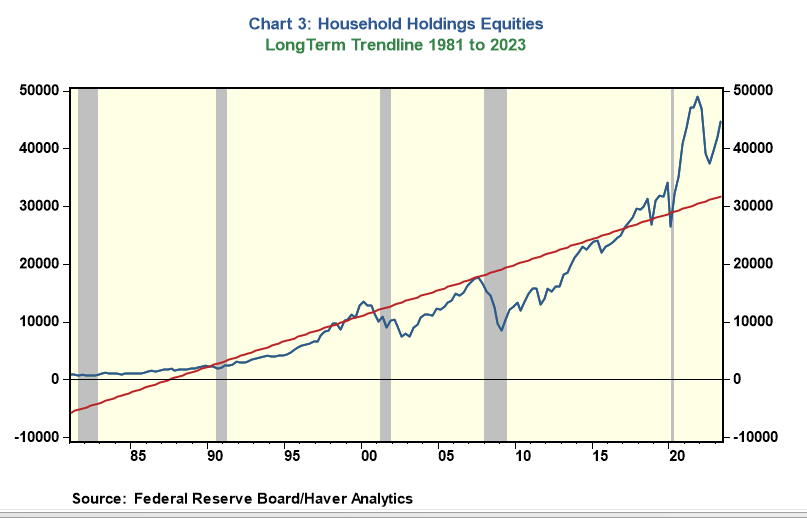
To offer some perspective on how massive this increase is, I ran a trendline on household net worth and its key components (i.e., the market valuations of real estate and equities). Trendlines provide a visual view of levels and speed of gains relative to a specific time frame, in this case, over the past 40-plus years, which coincides with the post-war peak in interest rates.
Chart 1 shows the household net worth chart relative to the 40-year-plus trendline, while charts 2 and 3 show the gains in household holdings of real estate and equities. The scale of the increases and the speed are historic. For example, real estate values have increased by $15 trillion or 30%, while equities have increased by $18 trillion, or over 60% from Q1 2020.
Trendline analysis does not offer a view of when something that appears out of sync with historical trends will be corrected. Looking at the charts, one could have predicted that asset gains are not sustainable in the past few years, but higher highs have occurred. Still, many asset managers view assets to be well-overvalued. (Note: for an investment opinion on the current valuation of equities and real estate, see Randall Forsyth, Barrons Up and Down Wall Street article October 20, 2023, "With Bond Yields Rising, Stocks and Homes Look Increasingly Overvalued").
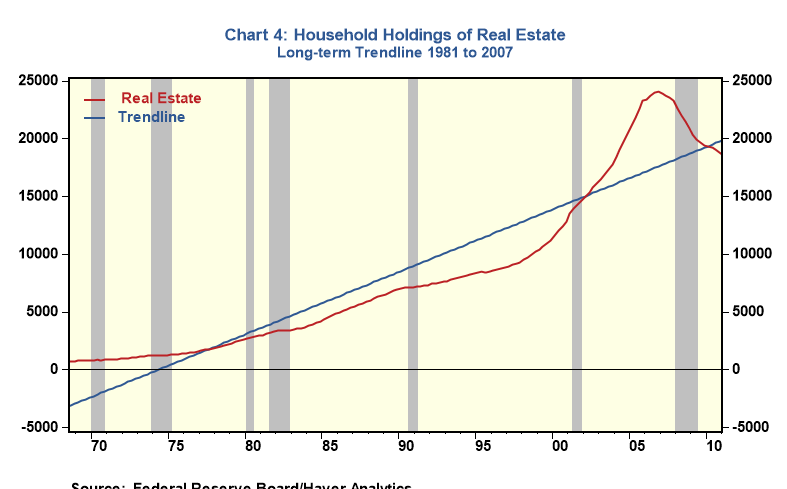
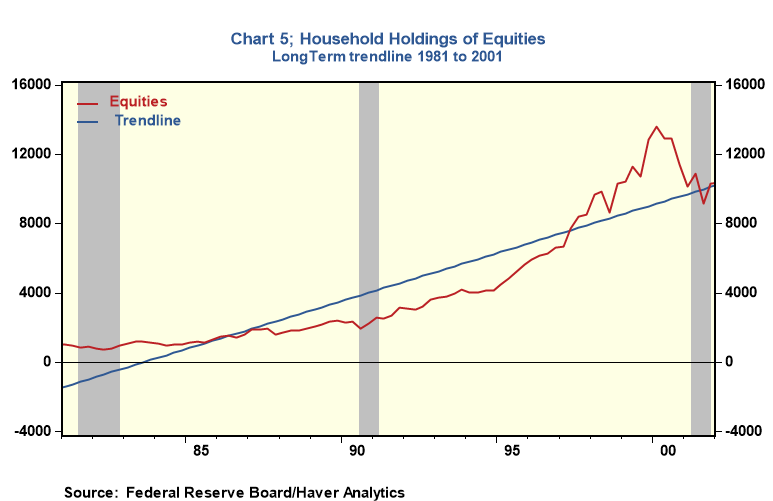
Trendlines adjust and go up and down after each cycle, and what appears to be out-of-line at the time might seem less extreme years or decades later. For example, the equity bubble of the late 1990s and the housing bubble of the mid-2000s do not appear to be excessive on the trendline from starting in 1981.
But a different perspective emerges when the trendlines or the visual view of the equities end in 2000 and the housing in 2007. Charts 4 and 5 show that in the moment of the specific cycle, real estate valuations were far above the trend in 2007, and equity values were equally so in the late 1990s and early 2000.
Identifying an over-valued asset market (a bubble) is challenging and only readily apparent long after. Still, the vast gains in equity values in the late 1990s and real estate in the mid-2000s highlighted the risks. In the end, those gains proved unsustainable, and the reversal, mainly the correction in real estate, triggered unprecedented declines in wealth, pushing the economy into a deep recession.
Based on the recent wealth and asset value gains, the scale of risks is higher nowadays than in 2000 and 2007. Households now have so much wealth and liquidity that a 10% correction would not trigger an economic downturn, but a 20% to 30% correction would. Oddly, as the risk of a market-driven recession increases, the forecasted risk of recession by economists has dropped to 34% at the end of the third quarter, down from 42% in the previous quarter, according to the survey of professional forecasters by the Federal Reserve Bank of Philadephia. Who will be right?






Fed policies created A LOT of easy money for a decade. The distortions will need reconciliation, starting from the valuation peaks so well identified herein. Nicely written article. Thanks.